|
||
|
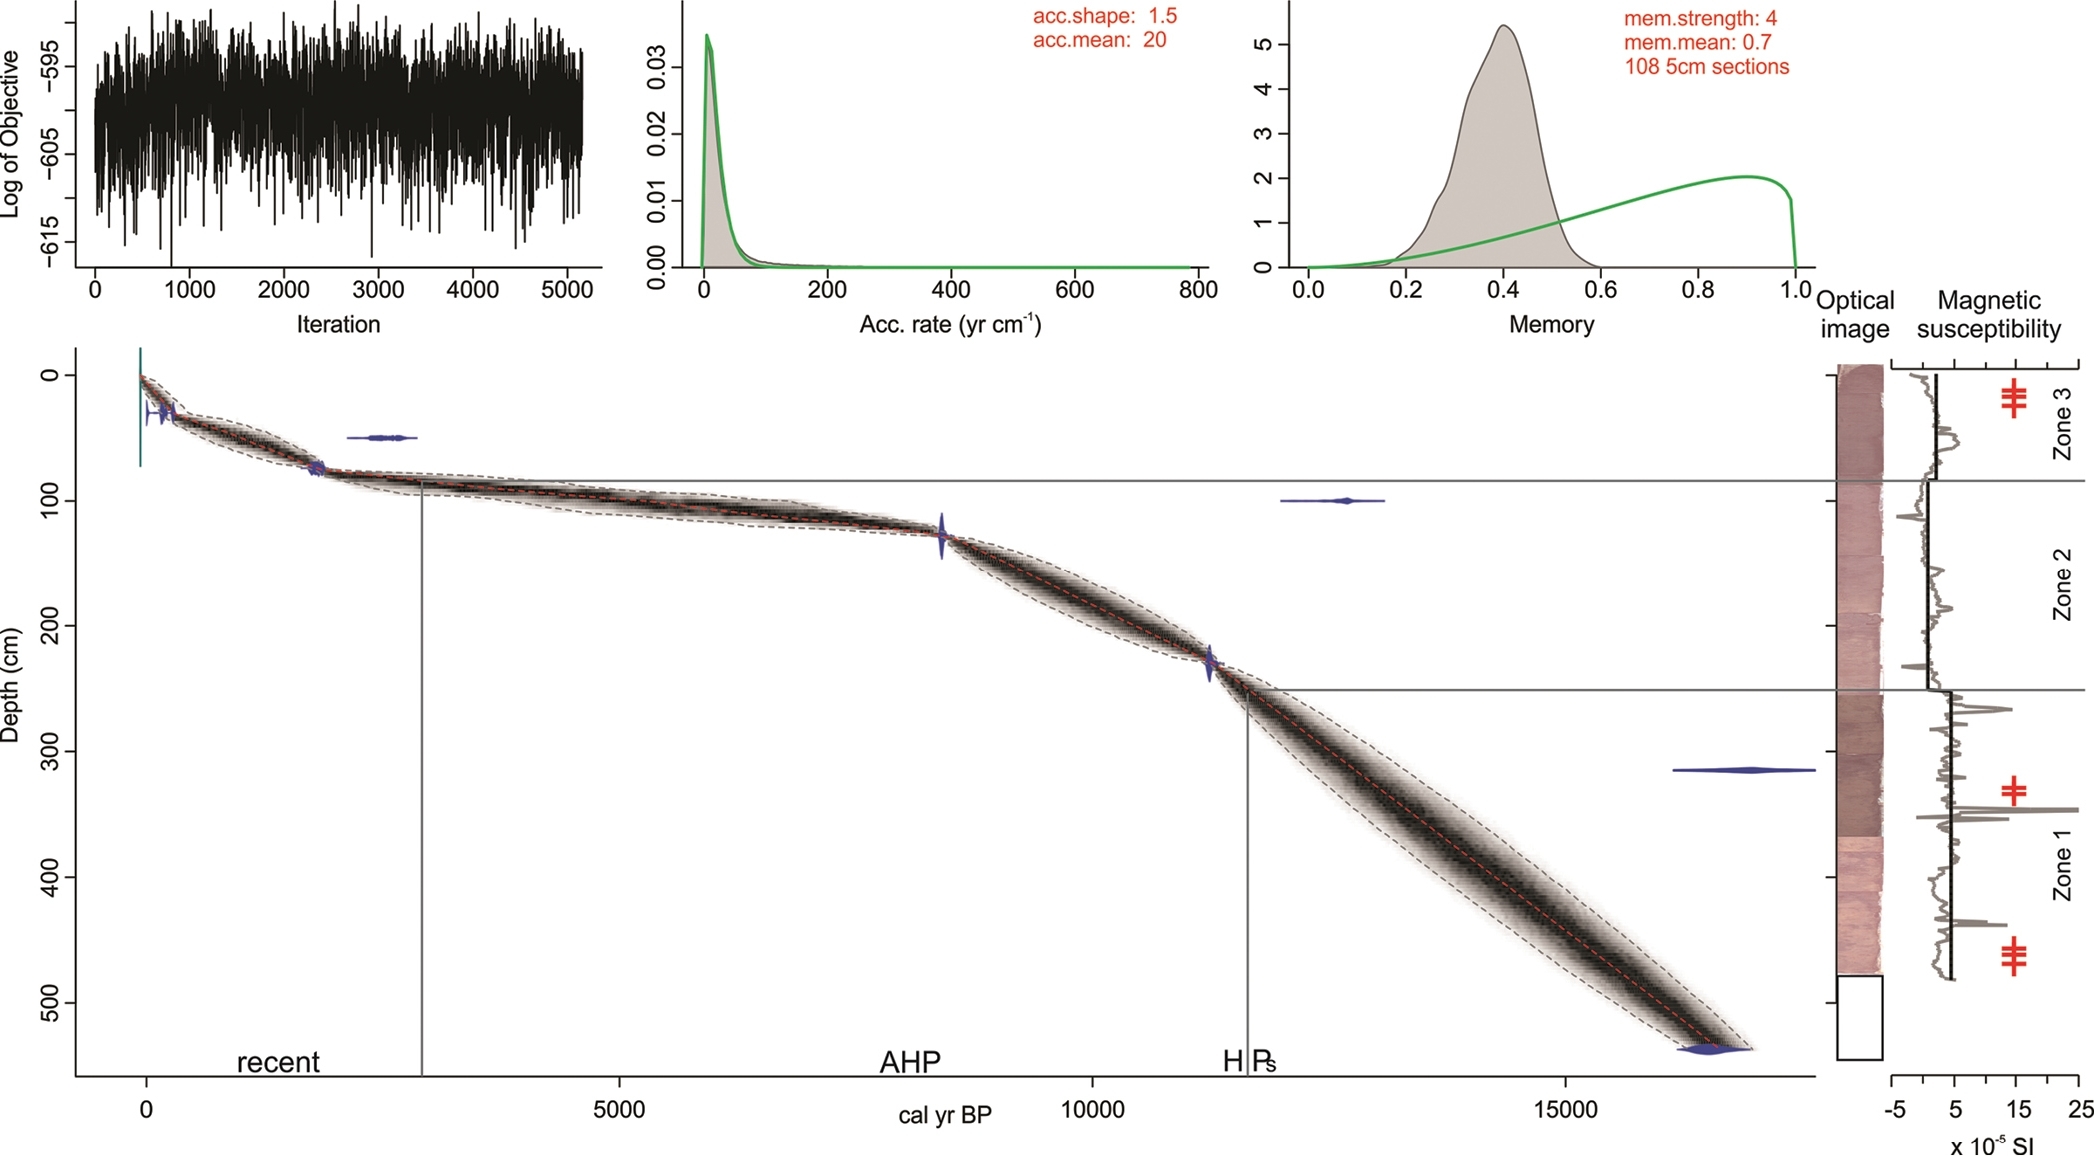
BACON version 2.2 R program language script age-depth model for the Enapuiyapui stratigraphy using MCMC random walks (greyscale shading) through the probable radiocarbon dates (1σ age probability distributions represented in blue) that were calibrated using the IntCal13 curve (Table 1; Blaauw and Christenson 2011; Reimer et al. 2013; R Development Core Team 2015). The final model used the weighted average of the random walk densities (red line) and 95% CI (dotted grey lines) and parameter settings are shown at the top right (red font). Ages reported as calibrated year BP (before present, 1950 CE). ITRAX optical core face photographs and magnetic susceptibility profile (grey line) at bottom left that shows the 484–0 cm section of the 537 cm core. Zones were defined using a regime shift index of the magnetic susceptibility values (Rodionov 2004). Lophopodella capensis presence data are represented by red ‘+’ symbols on the magnetic susceptibility profile. Abbreviations are AHP: African Humid Period, H: Holocene, Ps: Pleistocene. |